Building an EFK Stack for K3s Logging and Monitoring using Rancher
Introduction
It’s no secret that I enjoy metrics and dashboards - just go look at the About Me page sometime. When I set out to learn K3s, I never knew I’d be hosting production workloads, like this blog, from my K3s cluster. So, naturally, I wanted to peer inside Pods and such, and both view and visualize logs and metrics related to those Pods and more.
Assumptions
This tutorial assumes you’re using Rancher to manage your K3s cluster, as many of the steps installing applications via Helm charts will be conducted via Ranchers “App” store feature.
This tutorial also assumes your K3s cluster has decent compute resources as this stack can be quite memory intensive and also consume a fair amount of disk space.
What’s an EFK Stack?
EFK, or Elasticsearch + Fluent Bit + Kibana, is a logging/monitoring stack that together will collect logs and other metrics from your Kubernetes Nodes, Pods, Containers, and more.
Creating a Dedicated Namespace
To keep all relevant resources together for this setup, we’re going to create a dedicated namespace for that purpose. Create a namespace called “logging” to store all EFK-related deployments within by issuing the following command:
1
$ sudo kubectl create namespace logging
Add the Elastic.co Helm Repository to Rancher
In order to install Elasticsearch and Kibana later, you’ll need to add the Elastic.co Helm Repository to Rancher.
To do this, go to Apps > Repositories and then click “Create”
- Name the repository
elastic - Populate the Index URL with
https://helm.elastic.co
Once complete, click Create at the bottom.
Now you’ll be able to find Elasticsearch and Kibana in the next steps.
Installing Elasticsearch via Helm Chart
We’re going to perform this step from within Rancher.
Within Rancher, go to Apps > Charts and search for “elasticsearch” Once you’ve selected it, perform the following steps to install and configure Elasticsearch:
- Click “Install” from the top-right of the page
- Set the namespace to
logging - Provide a name for the Elasticsearch deployment, such as
elasticsearch - Click “Next”
- Accept the default YAML configuration and click “Install”
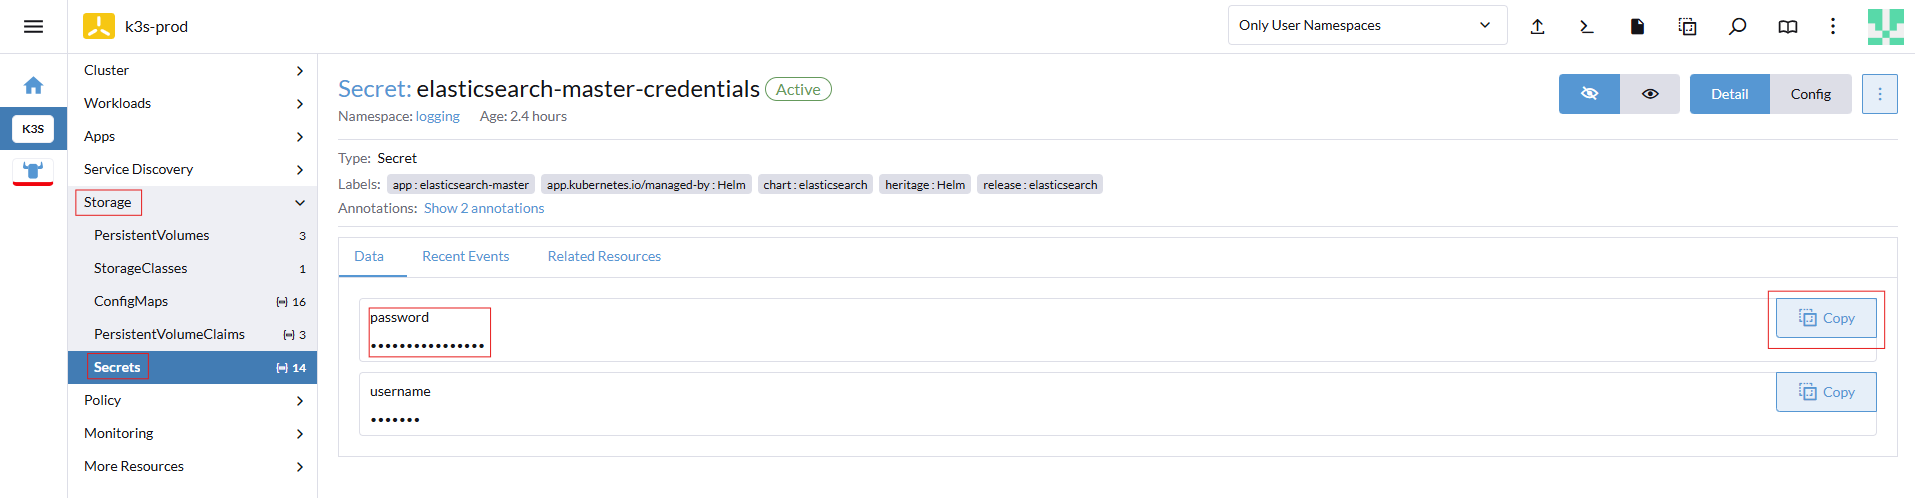
By default, the installation will create a Secret that contains the username (elastic) and a randomly-generated password used to authenticate to Elasticsearch and also log in using Kibana later.
To find the password, perform the following steps within Rancher:
- Click “Storage” and select “Secrets”
- Within the
loggingnamespace, you should see a Secret calledelasticsearch-master-credentials - Click
elasticsearch-master-credentialsand you can copy to the password
Install Kibana via Helm
We’re going to perform this step from within Rancher.
Go to Apps > Charts and search for “kibana” Once you’ve selected it, perform the following steps to install and configure Kibana:
- Click “Install” from the top-right of the page
- Set the namespace to
logging - Provide a name for the Kibana deployment, such as
kibana - Click “Next”
- Accept the default YAML configuration and click “Install”
Create an Elasticsearch Index
An index in Elasticsearch is where all log data and other data you (later) configure Fluent-bit to ship over to Elasticsearch to store and is where Kibana will look to retireve all that log data and metrics for viewing and searching later.
I’ve created two separate indices in my case, kube and host. The intent is that, through Fluent-bit, data originating from things such as Containers will go to the kube index. I’ll show an example later, but effectively, logs related to Containers that are otherwise stored on a cluster Node (/var/log/containers/*/*.log) will forward via Fluent-bit to the kube Elasticsearch index.
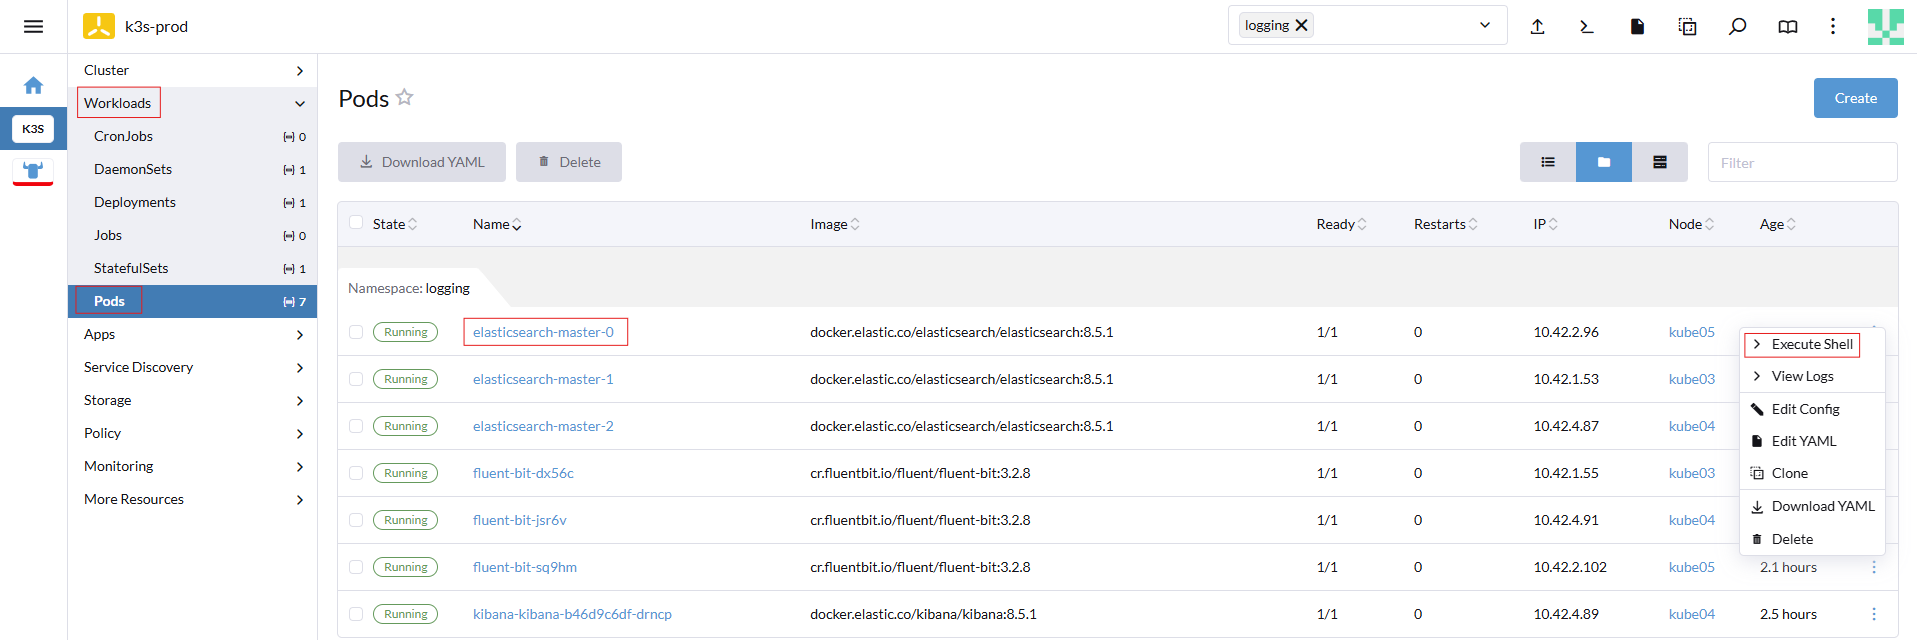
Within Rancher, find the Elasticsearch deployment and “Execute Shell” on the Elasticsearch pod and issue the following commands for each index you intend to create (i.e.: kube and host):
1
2
$ curl -k -XPUT -u elastic:<PASSWORD> https://elasticsearch-master:9200/kube
$ curl -k -XPUT -u elastic:<PASSWORD> https://elasticsearch-master:9200/host
Next, verify that the Elasticsearch indices were created:
1
$ curl -k -u elastic:<PASSSWORD> https://elasticsearch-master:9200/_cat/indices
Add the Fluent Bit Helm Repository to Rancher
In order to install Fluent Bit, you’ll need to add the Helm Repository to Rancher, similar to how we did the same for Elasticsearch/Kibana.
To do this, go to Apps > Repositories and then click “Create”
- Name the repository
fluentbit - Populate the Index URL with
https://fluent.github.io/helm-charts
Once complete, click Create at the bottom.
Install Fluent Bit via Helm Chart
We’re going to perform this step from within Rancher.
Go to Apps > Charts and search for “fluent-bit” Once you’ve selected it, perform the following steps to install and configure Fluent Bit:
- Click “Install” from the top-right of the page
- Set the namespace to
logging - Provide a name for the Kibana deployment, such as
kifluent-bit - Click “Next”
fluent-bit Configuration for Elasticsearch
Before comitting to installing, you’ll need to make a few adjustments to the YAML first!
Set the following outputs in the fluent-bit YAML configuration and ensure you change the HTTP_Passwd parameter and set Index to the desired name, based on what you named the index from the previous section.
This is based on trial-and-error to get data flowing into Elasticsearch via Fluent Bit it and in the correct format. I’ve worked trough the parsing issues I had long enough and this configuration has worked for me, anyways.
There are two [OUTPUT] stanzas - one for each Elasticsearch index we created earlier; one for K3s Node logs and one for host logs. Depending on the number of Elasticsearch indexes you created, copy/paste the [OUTPUT] stanza for each index you created and modify Match and Index parameters to match the name of each index.
1
2
3
4
5
6
7
8
9
10
11
12
13
14
15
16
17
18
19
20
21
22
23
24
25
26
27
28
29
30
31
[OUTPUT]
    Name es
    Match kube.*
    Host elasticsearch-master
    Port 9200
    HTTP_User elastic
    HTTP_Passwd <PASSWORD>
    tls On
    tls.verify Off
    #Logstash_Format On
    Retry_Limit False
    Suppress_Type_Name On
    Index kube
    Replace_Dots On
    Trace_Error On

[OUTPUT]
    Name es
    Match host.*
    Host elasticsearch-master
    Port 9200
    HTTP_User elastic
    HTTP_Passwd <PASSWORD>
    tls On
    tls.verify Off
    #Logstash_Format On
    Retry_Limit False
    Suppress_Type_Name On
    Index host
    Replace_Dots On
    Trace_Error On
Log into Kibana and Create Search Logs!
Assuming you’ve created an Ingress to access Kibana, log into Kibana using the username elastic and the password you obtained earlier.
From the left-side menu, you can select “Discover” under the “Analytics” section, and create a new data view matching your indexes!
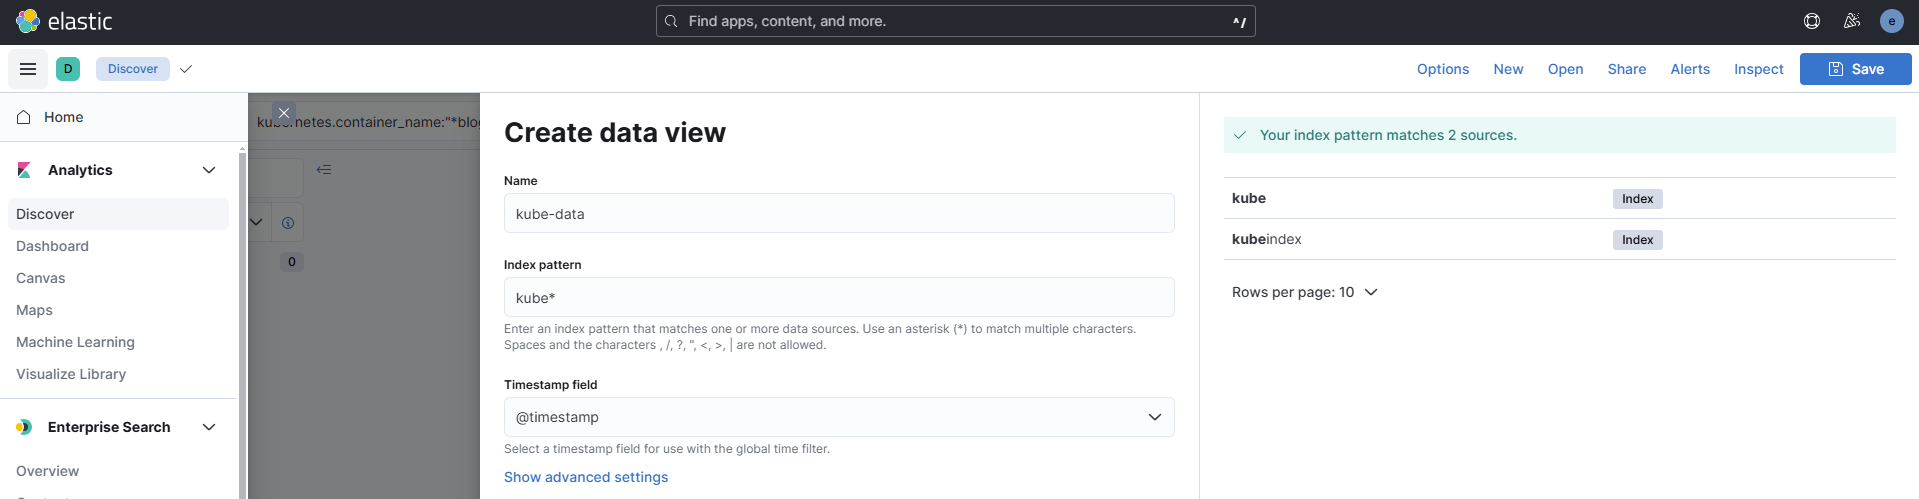
Now, you can explore your log data from your Pods, Containers, and so on!
Troubleshooting
One issue I ran into is if the fluent-bit Pods logs show “flesh” errors, within Kibana, delete the Elasticsearch index, recreate the Elasticsearch index, and try again. Review the fluent-bit Pod logs again to ensure the error does not persist.